Enrolled UCSF
183
Enrolled Oregon
292
Enrolled Michigan
949
Enrolled Mayo
251
| Characteristic | White N = 1,4521 |
Black or African American N = 671 |
Asian N = 481 |
Native Hawaiian or other Pacific Islander N = 11 |
American Indian or Alaskan Native N = 41 |
Middle Eastern or North African N = 81 |
Other N = 241 |
Unknown/not reported N = 301 |
Multiple N = 401 |
|---|---|---|---|---|---|---|---|---|---|
| Gender | |||||||||
| Cisgender Female | 737 (51%) | 38 (57%) | 16 (33%) | 1 (100%) | 4 (100%) | 2 (25%) | 10 (42%) | 15 (50%) | 18 (45%) |
| Cisgender Male | 576 (40%) | 24 (36%) | 30 (63%) | 0 (0%) | 0 (0%) | 6 (75%) | 12 (50%) | 12 (40%) | 15 (38%) |
| Transgender Female | 33 (2.3%) | 2 (3.0%) | 0 (0%) | 0 (0%) | 0 (0%) | 0 (0%) | 1 (4.2%) | 1 (3.3%) | 2 (5.0%) |
| Transgender Male | 38 (2.6%) | 1 (1.5%) | 1 (2.1%) | 0 (0%) | 0 (0%) | 0 (0%) | 0 (0%) | 0 (0%) | 1 (2.5%) |
| Gender Non-Binary (including genderqueer) | 65 (4.5%) | 2 (3.0%) | 1 (2.1%) | 0 (0%) | 0 (0%) | 0 (0%) | 1 (4.2%) | 2 (6.7%) | 4 (10%) |
| Unknown/not reported | 3 (0.2%) | 0 (0%) | 0 (0%) | 0 (0%) | 0 (0%) | 0 (0%) | 0 (0%) | 0 (0%) | 0 (0%) |
| Ethnicity | |||||||||
| Hispanic | 33 (2.3%) | 2 (3.0%) | 1 (2.1%) | 1 (100%) | 2 (50%) | 0 (0%) | 9 (38%) | 9 (30%) | 7 (18%) |
| Non-Hispanic | 1,395 (96%) | 64 (96%) | 45 (94%) | 0 (0%) | 2 (50%) | 8 (100%) | 15 (63%) | 11 (37%) | 32 (80%) |
| Unknown/not reported | 24 (1.7%) | 1 (1.5%) | 2 (4.2%) | 0 (0%) | 0 (0%) | 0 (0%) | 0 (0%) | 10 (33%) | 1 (2.5%) |
| IBD Type | |||||||||
| Crohn's disease | 832 (57%) | 48 (72%) | 23 (48%) | 0 (0%) | 1 (25%) | 5 (63%) | 16 (67%) | 17 (57%) | 25 (63%) |
| Ulcerative colitis | 588 (41%) | 19 (28%) | 25 (52%) | 1 (100%) | 3 (75%) | 3 (38%) | 8 (33%) | 12 (40%) | 15 (38%) |
| Indeterminate colitis | 29 (2.0%) | 0 (0%) | 0 (0%) | 0 (0%) | 0 (0%) | 0 (0%) | 0 (0%) | 1 (3.3%) | 0 (0%) |
| Other | 1 (<0.1%) | 0 (0%) | 0 (0%) | 0 (0%) | 0 (0%) | 0 (0%) | 0 (0%) | 0 (0%) | 0 (0%) |
| Unknown | 2 | 0 | 0 | 0 | 0 | 0 | 0 | 0 | 0 |
| 1 n (%) | |||||||||
| Characteristic | Case (SGM) N = 8571 |
Control (non-SGM) N = 1,6731 |
|---|---|---|
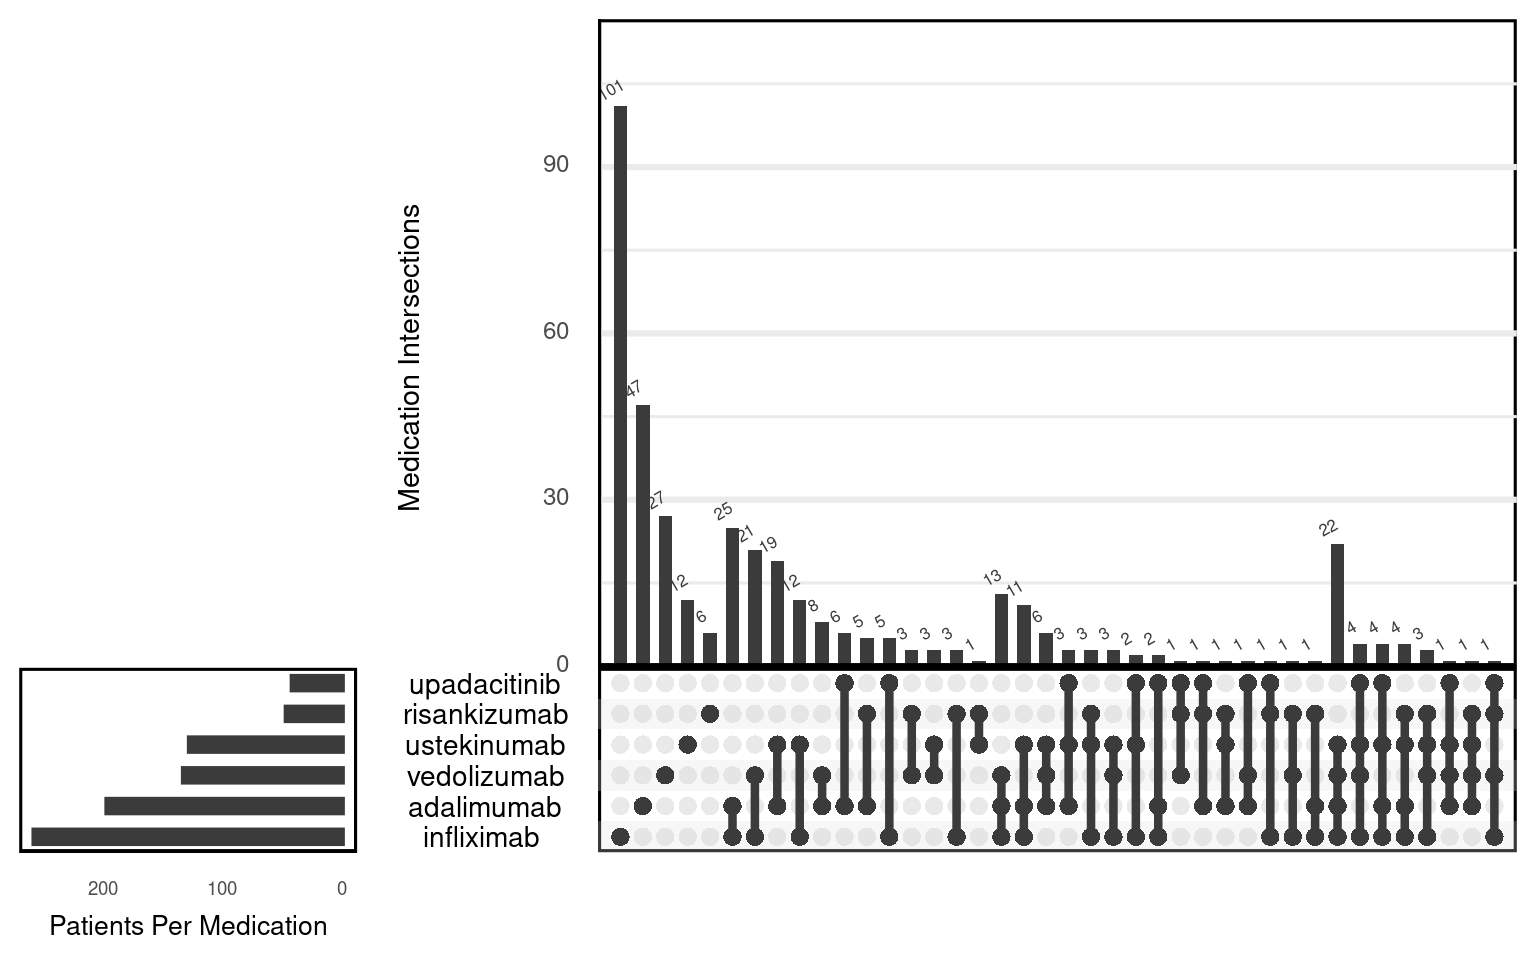
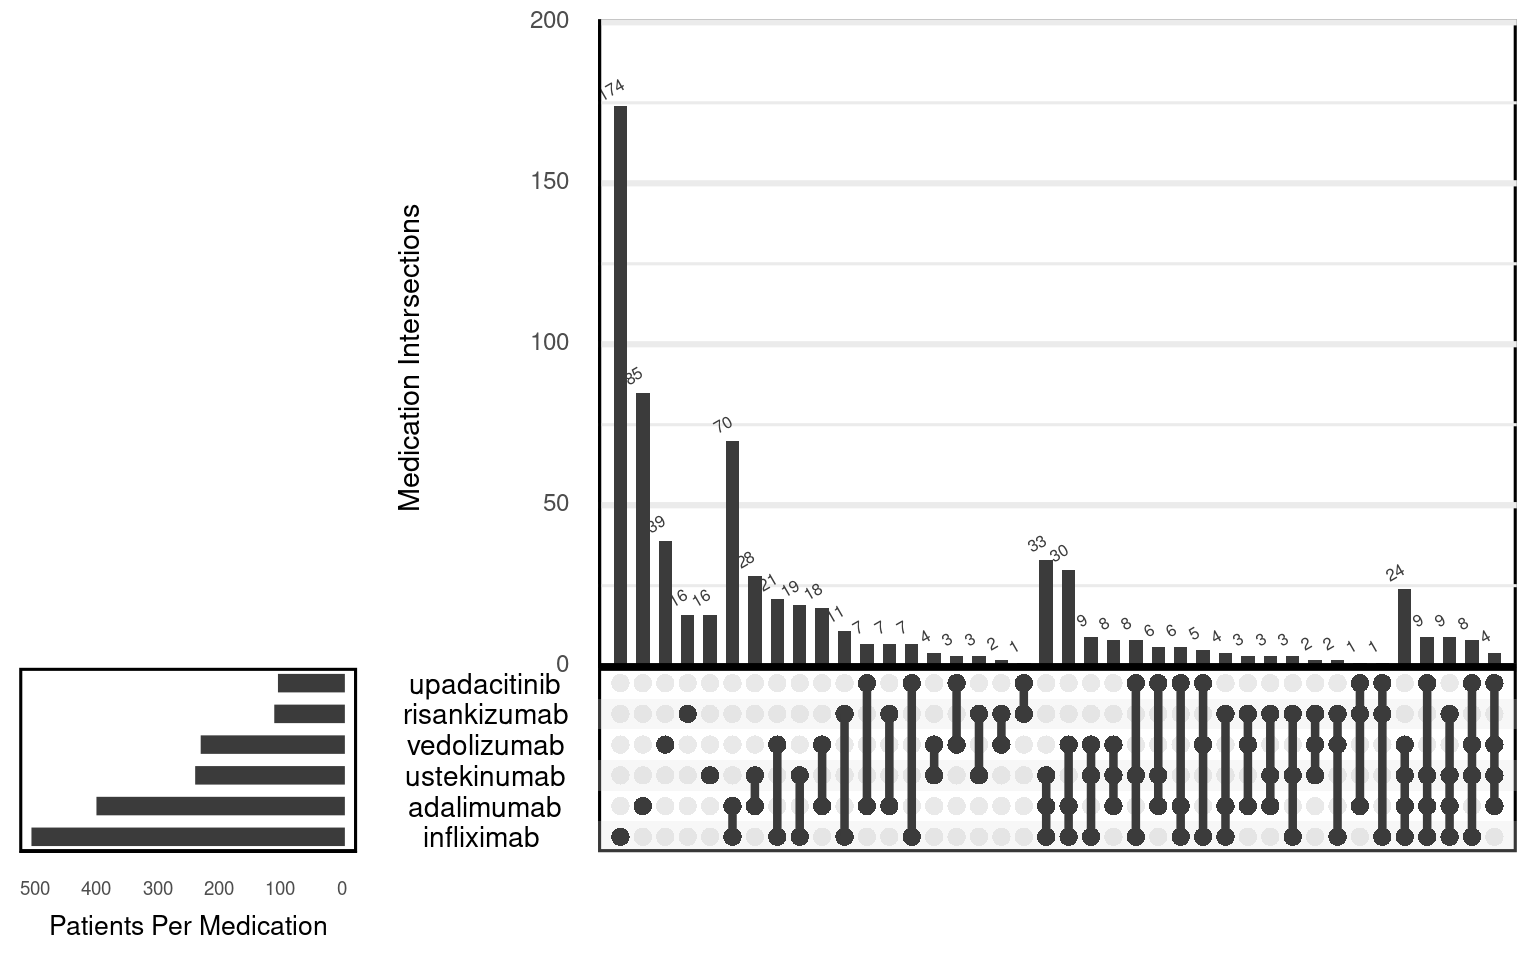
| Drug | ||
| adalimumab | 196 (23%) | 395 (24%) |
| certolizumab | 30 (3.5%) | 63 (3.8%) |
| etrasimod | 1 (0.1%) | 0 (0%) |
| golimumab | 8 (0.9%) | 6 (0.4%) |
| infliximab | 257 (30%) | 501 (30%) |
| IVIG | 0 (0%) | 1 (<0.1%) |
| mirikizumab | 1 (0.1%) | 2 (0.1%) |
| natalizumab | 1 (0.1%) | 2 (0.1%) |
| ozanimod | 2 (0.2%) | 0 (0%) |
| risankizumab | 46 (5.4%) | 105 (6.3%) |
| tofacitinib | 15 (1.8%) | 40 (2.4%) |
| upadacitinib | 41 (4.8%) | 99 (5.9%) |
| ustekinumab | 127 (15%) | 234 (14%) |
| vedolizumab | 132 (15%) | 225 (13%) |
| 1 n (%) | ||
| Characteristic | Case (SGM) N = 6541 |
Control (non-SGM) N = 1,0211 |
|---|---|---|
| Site | ||
| Mayo Clinic | 114 (45%) | 137 (55%) |
| Oregon Health and Science University | 122 (42%) | 170 (58%) |
| University of California San Francisco | 89 (49%) | 94 (51%) |
| University of Michigan | 329 (35%) | 620 (65%) |
| 1 n (%) | ||
| Characteristic | Case (SGM) N = 5691 |
Control (non-SGM) N = 9761 |
p-value2 |
|---|---|---|---|
| Depression history? | 347 (79%) | 377 (67%) | <0.001 |
| Unknown | 130 | 412 | |
| Bipolar history? | 56 (13%) | 33 (5.9%) | <0.001 |
| Unknown | 130 | 412 | |
| Anxiety disorder? | 359 (82%) | 485 (86%) | 0.070 |
| Unknown | 130 | 412 | |
| Post Traumatic Stress Disorder (PTSD)? | 93 (21%) | 48 (8.5%) | <0.001 |
| Unknown | 130 | 412 | |
| 1 n (%) | |||
| 2 Pearson’s Chi-squared test | |||
| Characteristic | Case (SGM) N = 5701 |
Control (non-SGM) N = 9761 |
p-value2 |
|---|---|---|---|
| How many hospital admissions for IBD (excluding scheduled surgery) did the patient have in the most recent 12 months of follow up? | 0.081 | ||
| 0 | 489 (86%) | 804 (82%) | |
| 1 | 60 (11%) | 109 (11%) | |
| 2 | 11 (1.9%) | 25 (2.6%) | |
| 3 | 7 (1.2%) | 17 (1.7%) | |
| 4 | 0 (0%) | 10 (1.0%) | |
| 5 | 1 (0.2%) | 3 (0.3%) | |
| More than 5 | 1 (0.2%) | 8 (0.8%) | |
| Unknown | 1 | 0 | |
| How many ER visits without hospitalization for IBD (excluding scheduled surgery) did the patient have in the most recent 12 months of follow up? | 0.8 | ||
| 0 | 503 (88%) | 863 (88%) | |
| 1 | 47 (8.3%) | 81 (8.3%) | |
| 2 | 12 (2.1%) | 14 (1.4%) | |
| 3 | 5 (0.9%) | 8 (0.8%) | |
| 4 | 0 (0%) | 3 (0.3%) | |
| 5 | 0 (0%) | 1 (0.1%) | |
| More than 5 | 2 (0.4%) | 6 (0.6%) | |
| Unknown | 1 | 0 | |
| 1 n (%) | |||
| 2 Fisher’s exact test | |||